Event Analytics Dashboard: 7 Numbers to Watch on Event Day
IQvent AI Team6 min read
In this article
- What should a live event dashboard show on event day?
- The 7 numbers to watch, and what to do when one looks wrong
- Who should watch the event analytics dashboard?
- How do you set up real-time event attendance tracking before the day?
- What should you report after the event?
- How IQvent AI handles live event dashboards
- Frequently asked questions
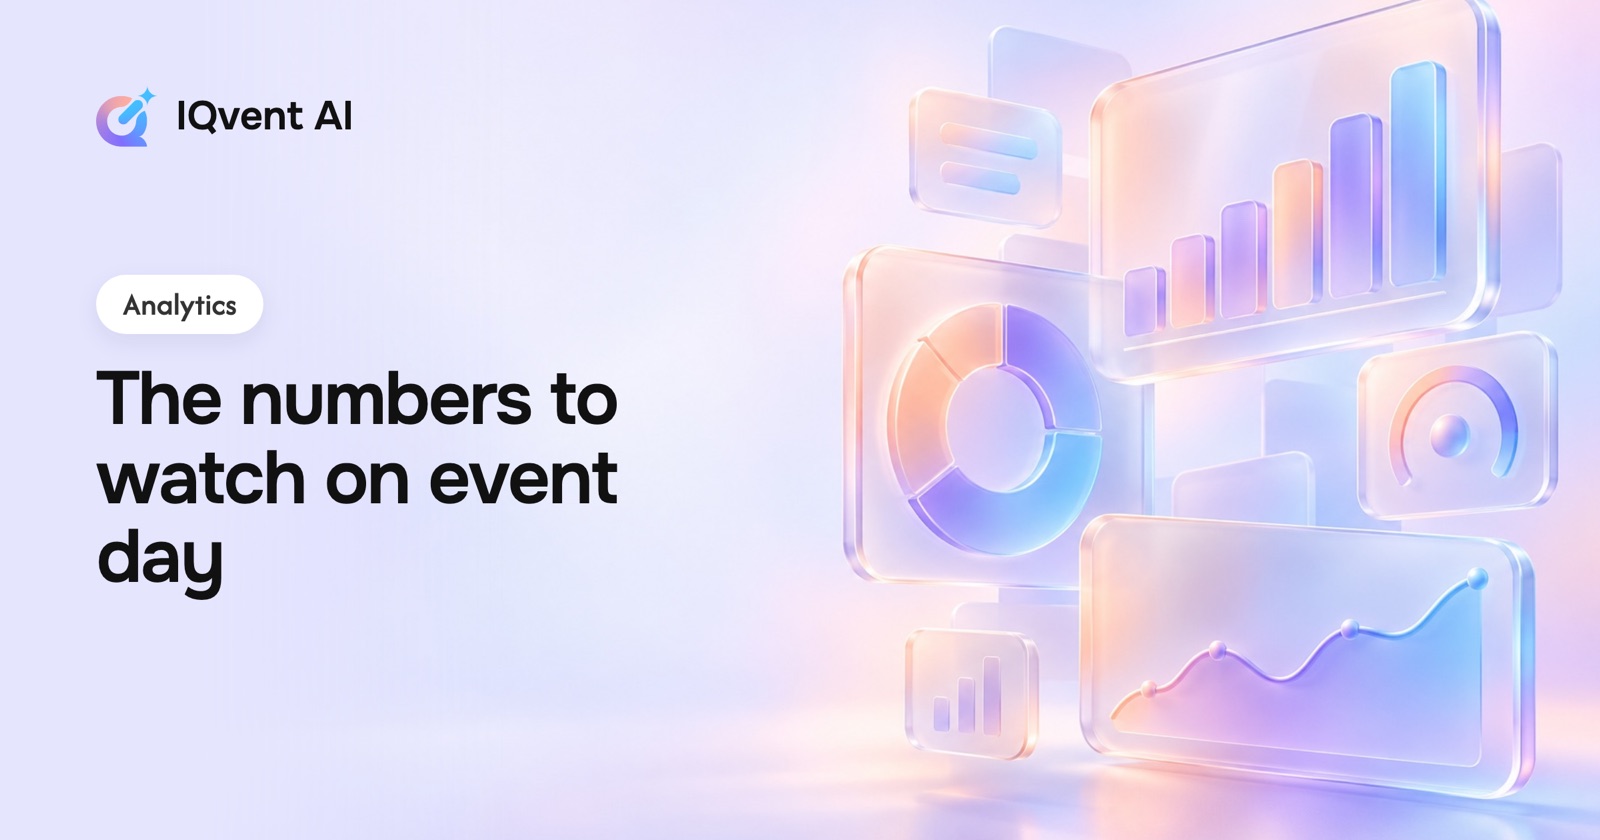
On event day, an event analytics dashboard should answer one question: is the day going to plan, and if not, where? The seven numbers worth watching are arrivals against registrations, arrival pace, check-ins per door, session attendance, engagement, walk-ins and no-shows by guest type.
Everything else can wait for the report. This guide covers what each number tells you, what to do when it looks wrong, who should be watching, and what to send round once the doors close.
Key takeaways
- Watch seven numbers on event day, starting with arrivals against registrations.
- Arrival pace by time tells you about queues before anyone complains.
- A flat line at one door can mean an offline scanner, not an empty entrance.
- Give one named person the live screen and a clear list of actions.
- Report the same numbers afterwards so the next event is planned on facts.
What should a live event dashboard show on event day?
A good live event dashboard shows what is happening now, compared with what you expected. That comparison is the whole point. "We have checked in 216 guests" means little on its own. "We have checked in 216 of 420 registered guests, and the keynote starts in half an hour" tells you whether to worry.
So before the day, write down what you expect for each number. Real-time event attendance tracking is only useful when you have something to track against.
The 7 numbers to watch, and what to do when one looks wrong
- Arrivals against registrations: This is your headline. If it lags well behind plan, check for a traffic or transport problem and decide early whether to hold the opening session. If it runs ahead, open spare doors and tell catering.
- Arrival pace by time: Look at check-ins per quarter hour, not just the running total. A sudden spike means a queue is forming. Move a floating staff member to the busiest door before the line reaches the street.
- Check-ins per gate or door: If one entrance is doing most of the work, redirect guests with signage or a staff member at the split. If one door shows nothing at all, walk over. It may be quiet, or the scanner may be offline and waiting to sync.
- Session attendance: Scans at the session door show which rooms are full and which are thin. An overflowing room may need a bigger space; a near-empty one might need an announcement in the main hall.
- Engagement activity: Poll answers and Q&A questions tell you whether the room is with the speaker. If a poll gets almost no responses, check the basics: was the prompt on screen, did the host invite answers, is the Wi-Fi working?
- Walk-ins and on-the-spot registrations: These drain badge stock, seating and catering. If walk-ins climb faster than you planned, tell the badge desk, check approvals are keeping up, and warn the caterer before lunch, not during it.
- No-shows by guest type: Break no-shows down by speakers, VIPs, exhibitors and general guests. A missing speaker is a phone call right now; missing general guests may mean seats you can release.
Tip: For each number, agree in advance what "looks wrong" means and who acts. A dashboard nobody acts on is just a television.
Who should watch the event analytics dashboard?
One person should own the screen. Not the event lead, who will be pulled in every direction, but a calm operations person with a radio or a phone group to the floor. Everyone else gets the one or two numbers they need.
| Role | Numbers they need | What they do with them |
|---|---|---|
| Operations lead | All seven | Spots problems and sends people to fix them |
| Door and registration lead | Pace, check-ins per door, walk-ins | Moves staff, opens or closes lanes |
| Programme or stage manager | Arrivals, session attendance, engagement | Holds or starts sessions, briefs hosts |
| Guest relations | No-shows by guest type | Calls missing speakers and VIPs |
| Catering contact | Arrivals and walk-ins | Adjusts service timing and quantities |
For a small event with one door and one room, a single organiser glancing at a phone is enough. The value of a live screen grows with the number of doors, rooms and guest types.
How do you set up real-time event attendance tracking before the day?
Most dashboard problems on the day are set-up problems from the week before:
- Decide which doors, sessions and booths will have a scan point, and name them clearly so the dashboard is readable.
- Tag guests by type at registration (speaker, VIP, exhibitor, guest) so no-shows can be split later.
- Write your expected arrival curve: how many guests by doors open, first session and lunch.
- Test every scanner on the venue network, and with the network off, the day before.
- Agree which numbers trigger which action, and who is allowed to make the call.
- Put the live screen where the operations lead can see it without blocking the registration desk.
If you want the check-in side covered in detail, our QR code event check-in guide and event day check-in checklist go through scanners, lanes and staffing.
What should you report after the event?
The post-event report should use the same numbers you watched live, so the story is consistent. Keep it short.
- Turnout: Final arrivals against registrations, split by guest type.
- Arrival curve: When guests actually came, against when you expected them. This shapes staffing and doors-open time next year.
- Door balance: Which entrances were busy and which were barely used.
- Sessions: Attendance and poll or Q&A activity per session, which helps with room sizes and the next programme.
- Walk-ins and no-shows: Useful for setting registration caps and catering numbers next time.
- What went wrong: Two or three honest lines on what you changed on the day. Often the most useful part.
At expos, send exhibitors their own booth scan counts separately and promptly.
How IQvent AI handles live event dashboards
IQvent AI puts registrations, check-ins and engagement on one live arrivals dashboard. The arrival count climbs as each guest is scanned, whether that scan is at the main door, a session or a booth. On the free plan, staff check guests in with a phone; bigger events get dedicated hardware QR scanners at the door.
Check-in keeps scanning when the venue network drops and syncs when it is back. That is why a quiet door on the dashboard is worth a walk before you assume it is empty. Live polls and Q&A run in the branded event app, covered in our guide to branded event app features.
Events with fewer than 150 guests are free. Larger events are priced on quote, and you can see what is included on the pricing section or book a demo to see the dashboard running.
Frequently asked questions
What is an event analytics dashboard?
An event analytics dashboard is a live screen that shows registrations, check-ins and engagement as they happen during an event. Organisers use it to compare what is happening with what they planned, so they can move staff, hold sessions or open doors before small problems become big ones.
Which metric matters most on event day?
Arrivals against registrations is the headline number, because it tells you whether turnout is on plan. Read it alongside arrival pace by time, which shows queues forming before guests start to complain. Together they cover most decisions you will make in the first hour.
Who should watch the live event dashboard?
One named operations person should own the live screen, with a radio or phone group to the floor. Other roles, such as the door lead or stage manager, only need the one or two numbers that drive their own decisions. The event lead is usually too busy to watch it properly.
Do small events need real-time event attendance tracking?
Small events with one door and one room can manage with a phone and a quick glance at the guest list. Live tracking becomes more valuable as you add entrances, parallel sessions and different guest types. Even for small events, the post-event turnout numbers are worth keeping.
What should a post-event attendance report include?
Include final turnout against registrations by guest type, the actual arrival curve, door balance, session attendance, engagement per session, walk-ins and no-shows. Add two or three honest lines on what went wrong and what you changed on the day, because that is what improves the next event.